David's Astronomy Pages (All Sky Camera)
Aurora on night 2019-01-31 / 2019-02-01
Aurora
2018-12-09
All Sky
Images
Home
Page
Aurora
2019-02-01
David's Astronomy Pages (All Sky Camera)
|
Aurora 2018-12-09 |
All Sky Images |
Home Page |
Aurora 2019-02-01 |
Aurora Notes
Pictures Videos Summary Plot Magnetometer Stack Plots (for reference) Planetary K-Index Plot (for reference) Aurora Forecast, NOAA/Ovation (for reference)
- Aurora display in NE Scotland
- Activity observed from 21:23 to 23:35 hUT (Kp5).
- Peak of activity at ~22:20- - Telescope Images from 2019-01-31 >> -
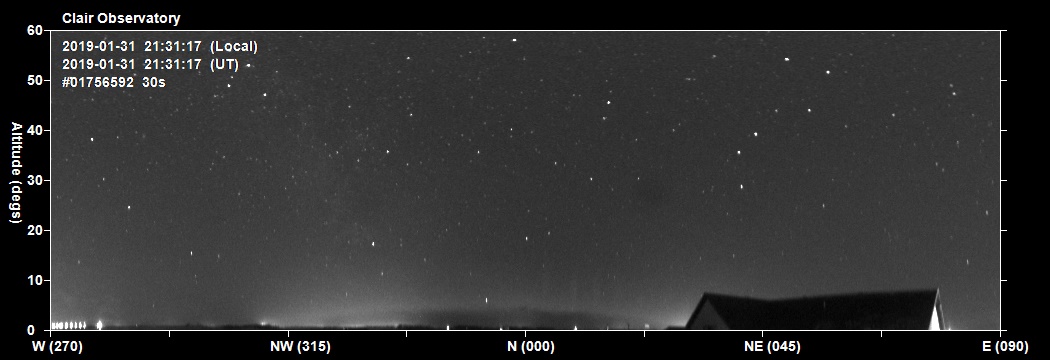
| Panoramic View - Northern Sky |
| 2019-01-31 21:31h UT (GMT) Aurora developed on N horizon, auroral arc + some vertical rays |
 |
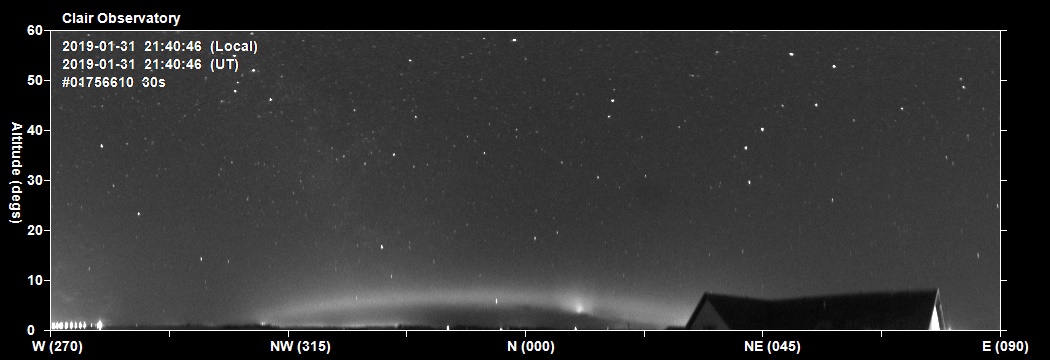
| 2019-01-31 21:31h UT (GMT) Arc brightening , bright area developing |
 |
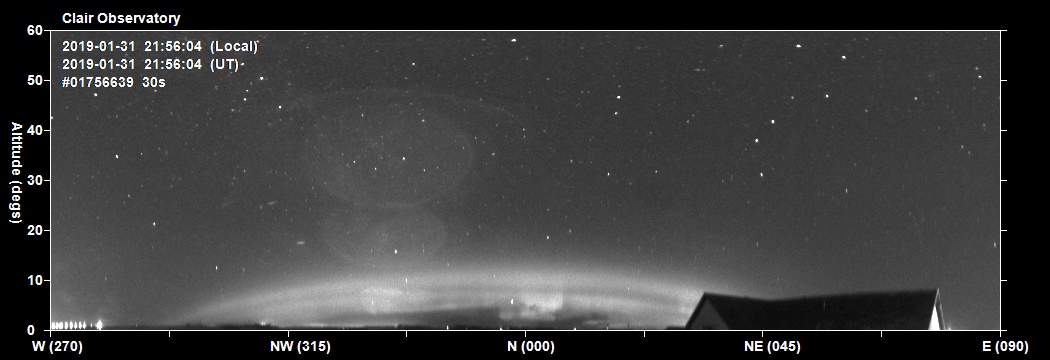
| 2019-01-31 21:56h UT (GMT) Second arc now developing. Curtains moving along horizon on lower arc. |
 |
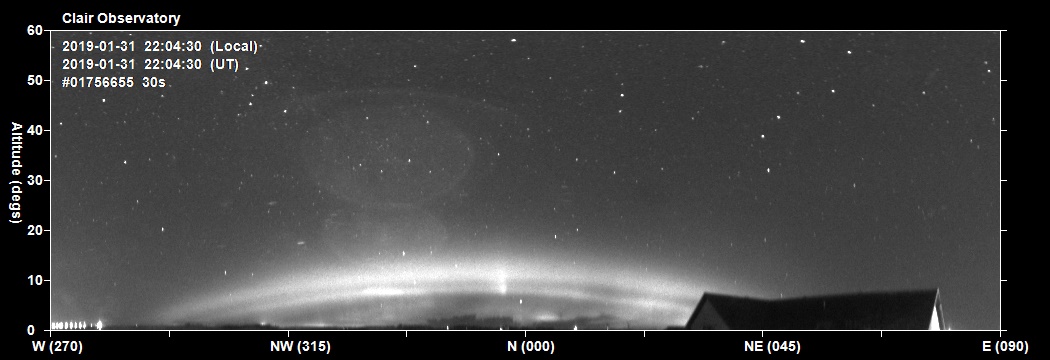
| 2019-01-31 22:04h UT (GMT) Arc brightening and increasing in altitude. Some brighter rays |
 |
| 2019-01-31 22:10h UT (GMT) Two bands, both particularly bright in the NNW sky, curtains moving along horizon |
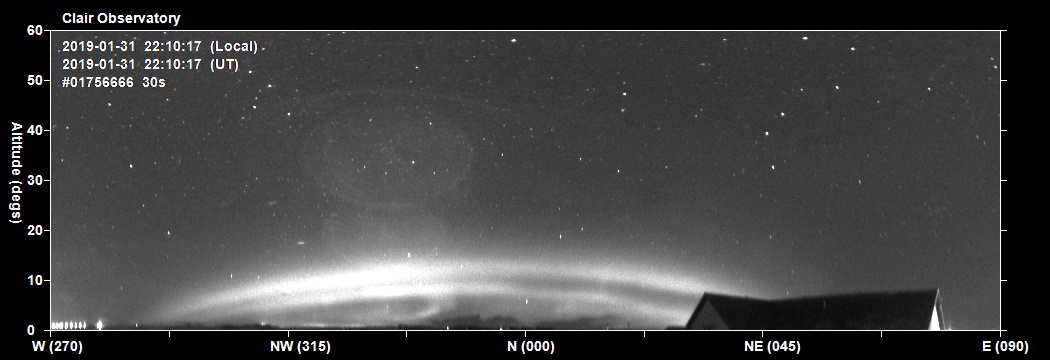 |
| 2019-01-31 22:21h UT (GMT) Upper band separating on increasing in altitude . Lower band/curtain in NW sky. Close to peak activity. |
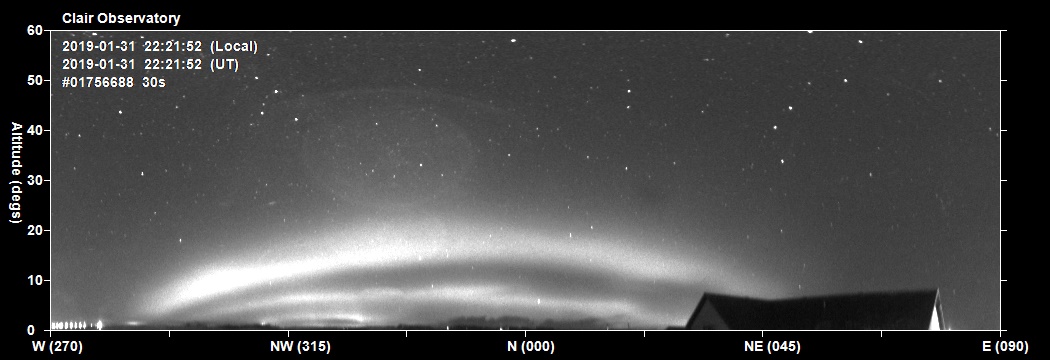 |
| 2019-01-31 22:36h UT (GMT) Upper band weakening. Lower band lowering in altitude. |
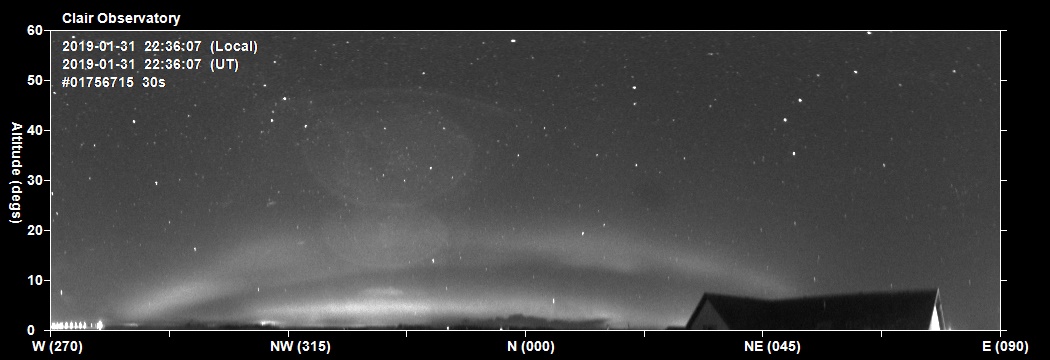 |
| 2019-01-31 22:52h UT (GMT) Two arcs/bands still visible but activity and brightness now weakening. |
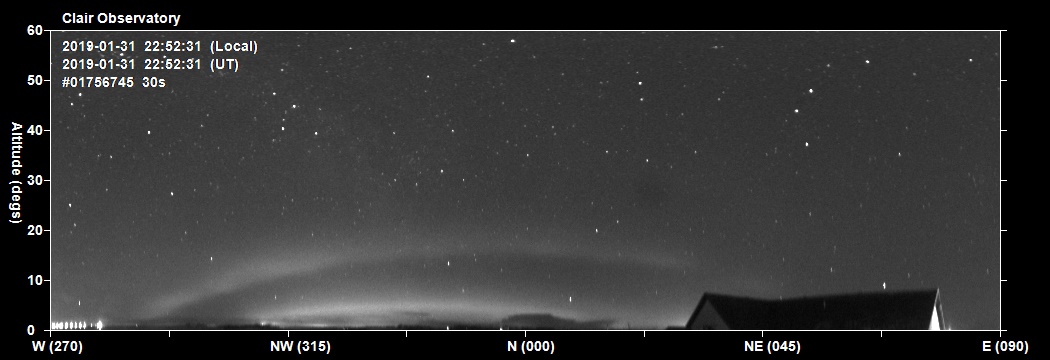 |
| 2019-01-31 23:23h UT (GMT) Activity dying away. Aurora still visible in this image at 23:23, but disappears by 23:35. |
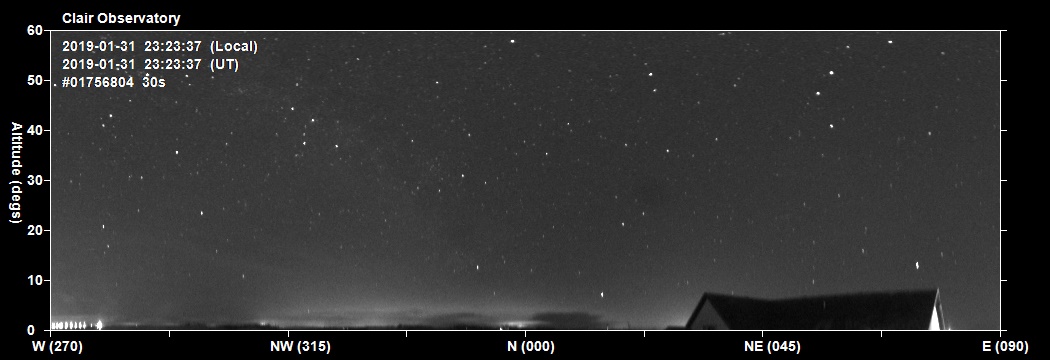 |
| Panorama views of northern sky converted from original fish eye
images 30s exposures taken with Oculus All Sky Camera |
| Fish-Eye View of Aurora 2019-01-31 22:21h UT (GMT) - Close to peak activity. |
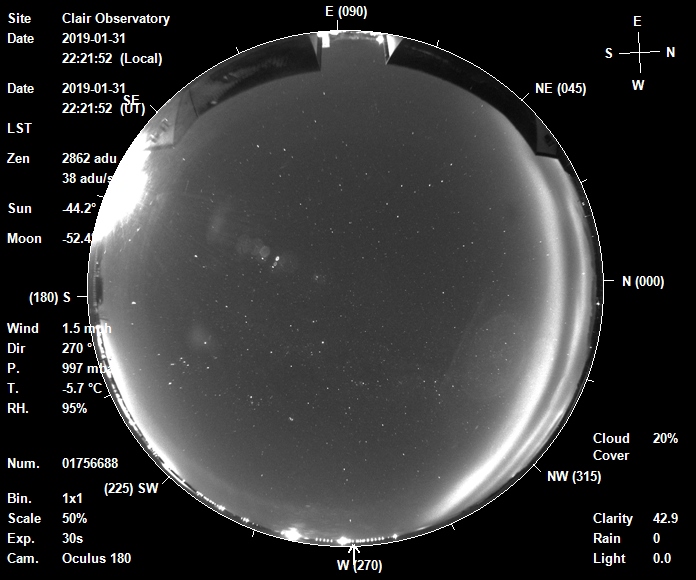 |
| 30s exposure taken with Oculus All Sky Camera |
Back to Top
| Video: North panoramic view, 3 hour period
2019-01-31 21:00 to 23:59 UT (GMT), Frames 1756534-873 |
| Link to .mp4 video file (7.6 MB) |
|
0.0s
/ 0.0s
|
Back to Top
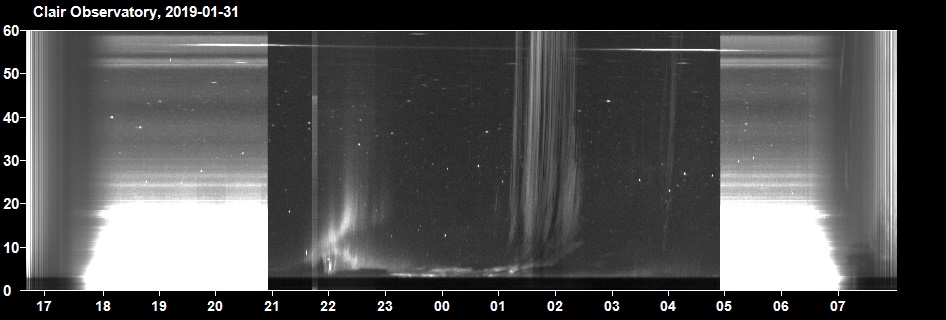
| Night Summary Plot - North Sky (2019-01-31 /
2019-02-01) Times on plot are local GMT times (= UT time) Whiteouts in image are due a security light at a nearby building site |
 |
Back to Top
| Magnetometer Stack Plots from Scandinavia
(ordered by latitude) H Component - 2019-01-31 / 2019-02-01 Original data from Tromsø Geophysical Observatory (TGO), DTU Space (Technical University of Denmark) and Finnish Meteorological Institute (FMI, displayed on SpaceWeatherLive http://www.spaceweatherlive.com/en/auroral-activity/magnetometers). Note: Geomagnetometer activity at rvk (Rorvik, 64.95N), dob (Dombas, 62.07N), sol (Solund, 61.08N) and kar (Karmoy, 59.21N) stations are used as indicators for potential auroral activity that may be visible from my Observatory situated at latitude 57.32N (Map of Stations) |
 |
|
|
Back to Top
|
Estimated 3 hour Planetary K-Index (NOAA) (K indices of 5 or greater indicate storm-level geomagnetic activity around earth) (from http://services.swpc.noaa.gov) |
 |
Back to Top
|
Aurora Forecast at 2019-01-30 24:00h UT for 24:00hUT (From Space Weather Prediction Centre, http://www.swpc.noaa.gov ) Image not available |
Back to Top
| This Web Page: | Aurora - 2019-01-31 |
| Last Updated : | 2021-11-02 |
| Site Owner : | David Richards |
| Home Page : | David's Astronomy Web Site |