David's Astronomy Pages (All Sky)North Sky / Aurora Watch |
Latest AllSky |
Aurora Page |
Home Page |
Latest Session |
David's Astronomy Pages (All Sky)North Sky / Aurora Watch |
Latest AllSky |
Aurora Page |
Home Page |
Latest Session |
Latest 3 hour video Link to .mp4 video file (normally c. 0.8-1.3 MB) >> Goto last nights colour video >> Goto last night's b/w video
Back to Top
Plot below is either the latest live plot for the current night or the final plot from last night (depending on the current time)
- plot is only updated between sunset and sunrise (see Prior North Sky Summary Plot )
- live plots may be up to 15 mins old depending on the time of the last automatic upload to website
Back to Top
Graphs below show activity and magnetogram charts
produced by the Observatory's new Geomagnetic Station for the
latest 24 hour period.
Due to an ongoing issue when running the Y Axis
Magnetometer, magnetometer readings are prone to sudden anomalous spikes
and give False Alarms on the Activity Plots. The spikes are
usually obvious but they can lead to orange or red alert bars on the activity
plot. Do not rely on them (i.e. don't go outside to look for Aurora) without
consulting other data sources.
Data |
Graph (24 hours) |
||
| Magnetometer Activity | |||
| Magnetometer Activity | |||
| Magnetogram | |||
|
High Resolution Variations (minute data) * experimental * |
|||
|
Stackplot (X) |
|||
|
Stackplot (Y) |
|||
|
Stackplot (Z) |
|||
|
Graphs from SAMNET Crooktree Station from Aurora Watch
UK website, scaled to the same size https://aurorawatch.lancs.ac.uk/plots/?project=samnet&site=crk2&date=rolling |
|||
|
Magnetogram (DHZ) |
|||
-
values may be up to 10-15 mins old depending on the time of the last automatic upload to
website).
- see
Geomagetic Station for additional charts.
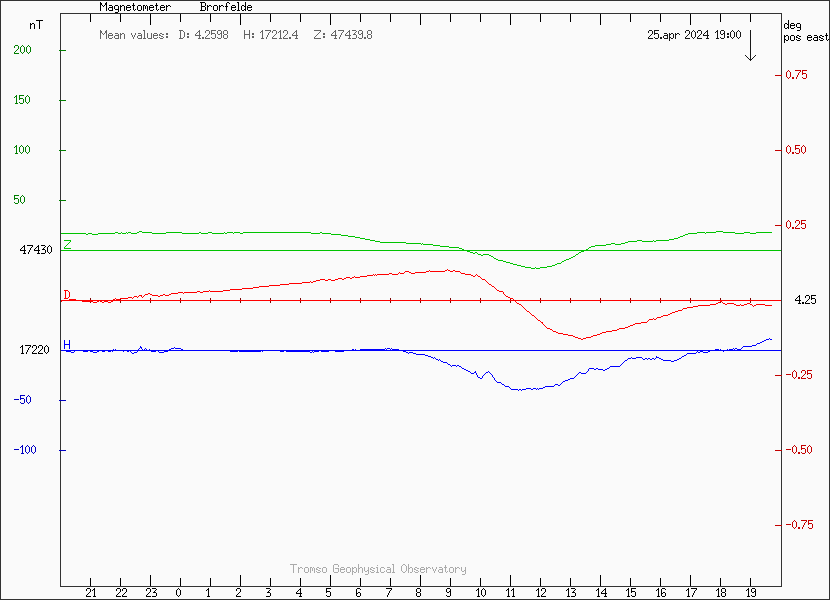
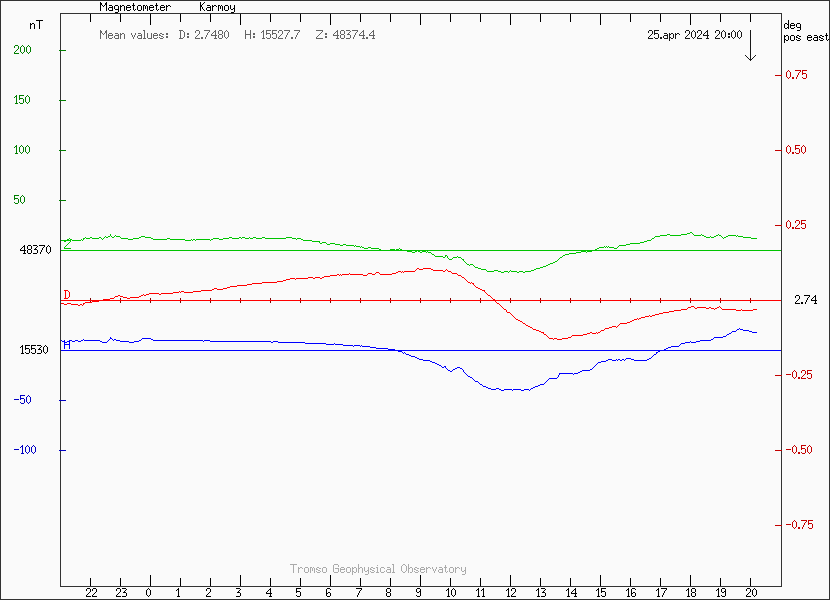
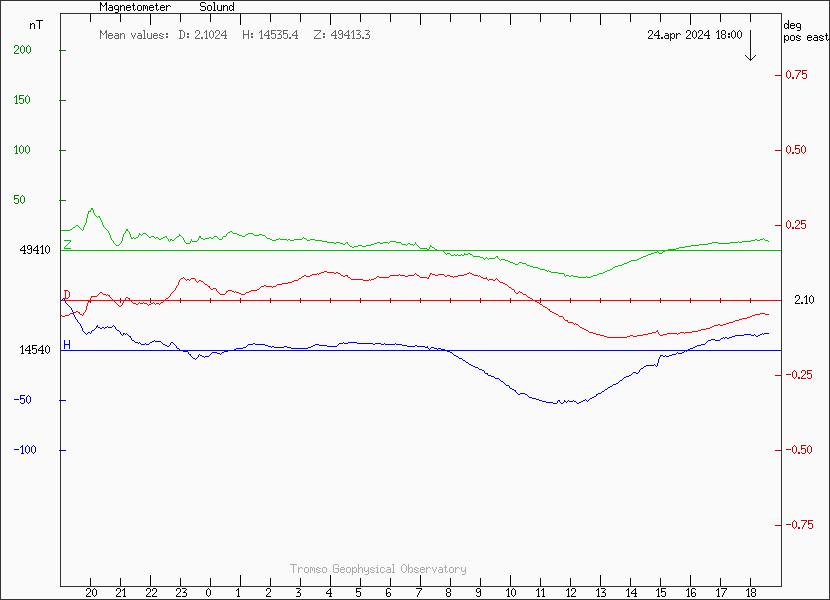
For comparison see Latest
24h Realtime Magnetograms on TGO Site, or direct to specific stations: see
Rømø,
Brorfelde,
Karmoy,
Solund,
Dombas
Back to Top
Magnetometer Stack Plots from Scandinavia (ordered by latitude)
Geomagnetometer activity at rvk (Rorvik, 64.95N), dob (Dombas, 62.07N), sol (Solund, 61.08N) and kar (Karmoy, 59.21N) stations are used as indicators for potential auroral activity that may be visible from my Observatory situated at latitude 57.32N
Data from Finnish Meteorological Institute (FMI), Tromsø Geophysical Observatory (TGO) & DTU Space (Technical University of Denmark)
(Data site : Tromsø Geophysical Observatory - Geomagnetic Data, See Map of Geomagnetic Stations )
[ If Image below is blank try here ]
See also StackPlot of European Magnetometer Stations on SpaceWeatherLive
http://www.spaceweatherlive.com/en/auroral-activity/magnetometers
Back to Top
Back to Top
SAMNET's magnetometer at Sumburgh, Shetland Is. (Chart Explanation)
For SAMNET's magnetometer at Crooktree, Near Torphins
see following link :https://aurorawatch.lancs.ac.uk/plots/?project=samnet&site=crk2&date=rolling
Back to Top
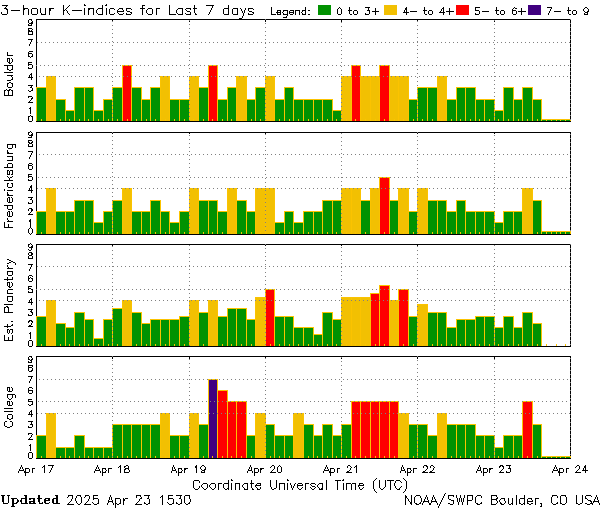
Estimated 3 hour Planetary K-Index (NOAA)
(K indices of 5 or greater indicate storm-level geomagnetic activity around earth)Previous planetary-k-index.gif picture is no longer available due to changes in how NOAA now present the graphic data. Graph has to be accessed through
web app at https://swpc-drupal.woc.noaa.gov/products/planetary-k-index.
Alternative picture is Station K Index file (from https://services.swpc.noaa.gov/images/station-k-index.png )Planetary K-Index and other information (Space Weather Prediction Centre) https://services.swpc.noaa.gov/
Back to Top
Picture with last 7 days data including the Lerwick site (https://geomag.bgs.ac.uk/images/kandkp_bar.jpg)
from BGS's UK Current Geomagnetic activity website (https://geomag.bgs.ac.uk/education/current_activity.html)10 day plots : Kp, Hp30 & Hp60 plots (Potsdam, GFZ German Research Centre for Geosciences)
Back to Top
Videos below show the North Sky from i) latest night and from ii) night prior to that, and cover the period whilst the sun is below -8° altitude.
Videos are taken with Tapo C325WB Colour Night Vision Camera and are replaced each morning by the latest video.
Latest NorthCam Night Video
(taken with Tapo C325WB Colour Night Vision Camera ) - using video-controls2.jslink to .mp4 video file (normally 10-16 MB) >> Goto last night's b/w video from AllSky Camera ,
>> Goto today's daytime colour video from NorthCam CameraNorthCam Prior Night Video
using video-controls3.jslink to .mp4 video file (normally 10-16 MB)
Back to Top
Picture below is the north sky summary plot from the night before last.
- The plot is replaced each day around sunset as a new night plot is started. (see Latest North Sky Summary Plot )
Back to Top
| This Web Page : | Aurora Watch |
| Last Updated : | See image annotation for latest date |
| Site Owner : | David Richards |
| Home Page : | David's Astronomy Web Site |